
Knowledge Box
While reading a book in a school library, Mukesh comes across a word that says “draft” whose meaning he does not know. So how does he find out the meaning of this word?
The simple answer to this is that Mukesh searches for the meaning of the word ‘draft’ in a dictionary. However, there are many words in a dictionary. So how does he find the word ‘draft’ in the dictionary?
To achieve this, he first needs to find the dictionary section with the first letter of the word, which in this case is ‘D.’ Then, within the list of words starting with the first letter ‘D’, he needs to find the section having the second letter of the word ‘R’. He needs to do this operation again with the third, fourth & fifth letters until he finally reaches the word ‘draft’ in the dictionary & then finds its meaning.
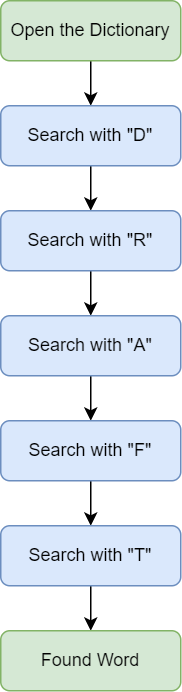
In other words, Mukesh needs to follow a set of steps to complete the task of finding the meaning of a word.
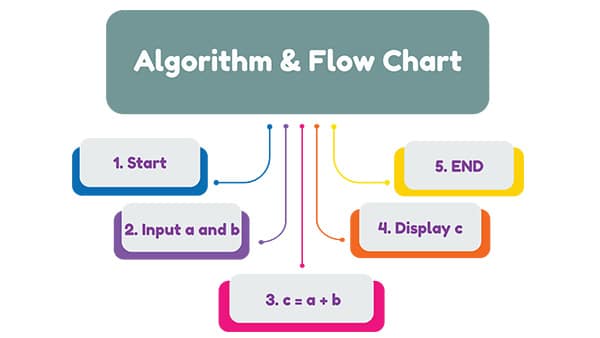
Similarly, before writing a program code for a given problem in computer science, it is essential to devise a set of steps to be followed to solve the problem successfully. This set of steps is called an algorithm.
An algorithm is defined as the CODING STEPS plan to solve the problem for a given problem statement.
Flowchart
A flowchart is a diagrammatic representation of the CODING STEPS plan to be followed for solving a task/problem statement.
This diagrammatic representation is made up of shapes like boxes, diamonds, parallelograms, circles, and ellipses connected by arrows. Each shape acts as a step in the solution, and the arrows represent the direction of flow among the steps.
Benefits of using a flowchart:
- It helps to explain your approach to solving a problem.
- The flowchart helps in bringing visual clarity to a problem, so it helps in practical problem-solving.
- Once you build a flowchart, this remains as documentation of the code you are about to build. If you need to come back and understand the code, you can refer to the flowchart.
Symbols Used in a Flowchart
| S No | Symbol Name | Definition | Image |
| 1 | Indicates start/stop / halt | 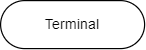 |
|
| 2 | Indicates instructions that either take inputs or display output. | 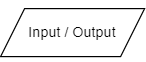 |
|
| 3 | Indicates instructions that represent computation. | 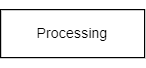 |
|
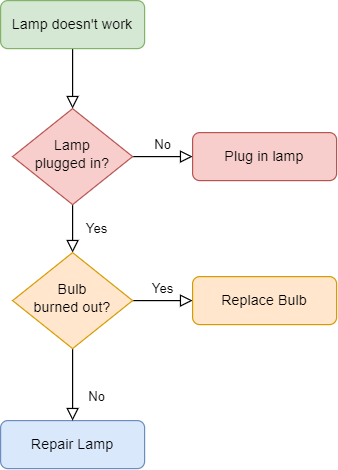
| 4 | Indicates decision-based operations such as Yes/No, or True/False. | 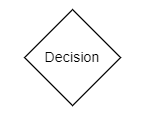 |
|
| 5 | Complex flowcharts which span over more than a page are connected via a connector. | 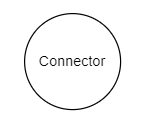 |
|
| 6 | Indicates the direction of flow of sequence in a flowchart. |  |
Activity 1: Profit & Loss
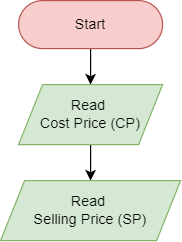
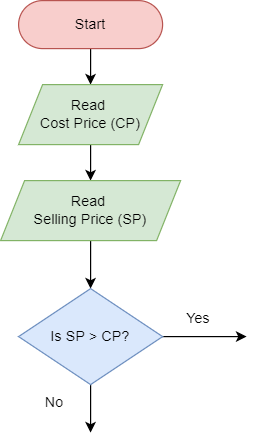
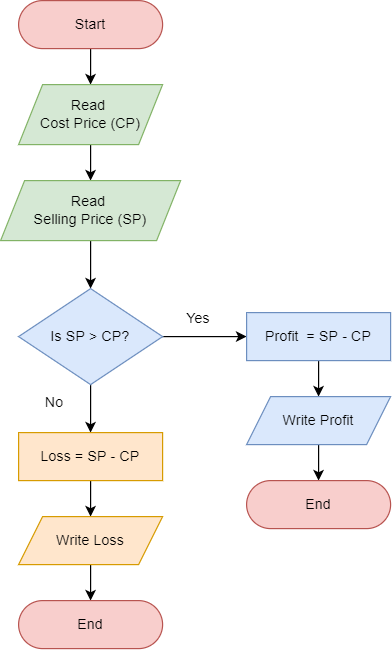
Let’s create a flowchart that takes two inputs, namely cost price, and selling price. It then calculates profit or loss depending on the values and prints the same.
Steps
Follow the steps below:
- Taking inputs – cost price and selling price from the user at the start.

- Create branches with identification of the profit and loss with the decision.

- Calculate the profit and loss values. Your flowchart is complete.
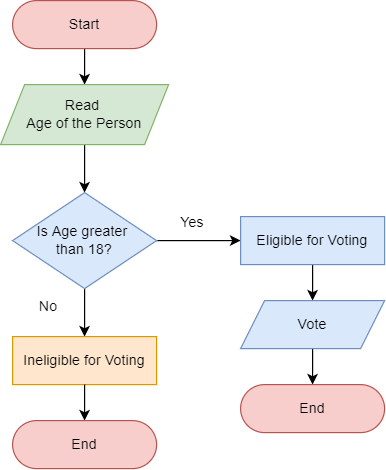
Activity 2: Eligible for Vote
Let’s create a flowchart that takes one input as age. It then checks if the person is eligible for voting or not.
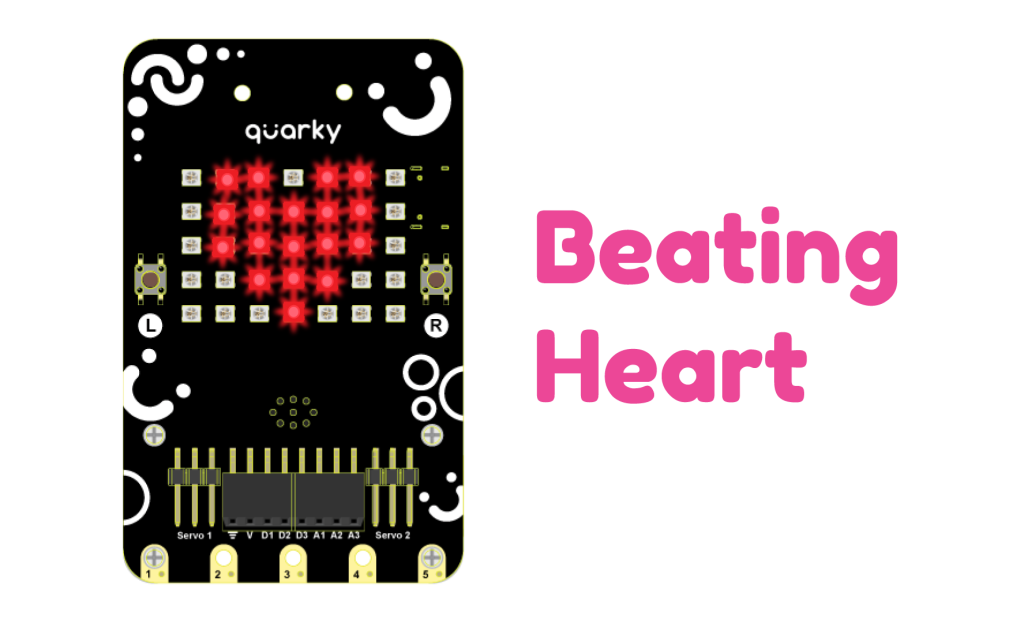
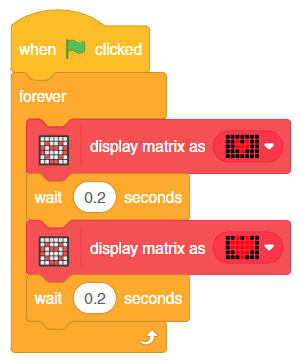
Activity 3: Beating Hearts
In this activity, we’re going to see how we can display a custom pattern on the matrix by making a script to display a beating heart.
Coding Steps
Follow the steps below:
- Open
PictoBlox App, go toMy Space, and click on+button to create a new file. - Connect
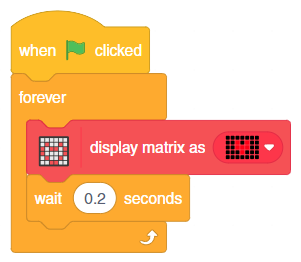
QuarkytoPictoBlox. - Drag and drop a when flag clicked block into the scripting area from the
Eventspalette. - Add a forever block from the
Controlpalette below the when flag clicked block. - Inside the forever block, add a display matrix as () block from the
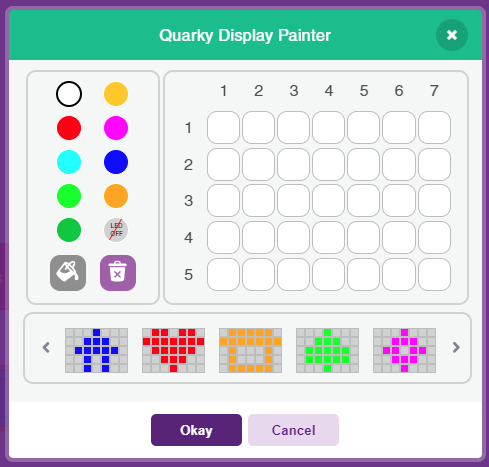
Displaypalette. - Open the drop-down by clicking on the tiny white arrow as shown in the image. Draw a small heart in the middle of the matrix.

- Add a wait () seconds block under the display matrix as () block and set the waiting time as 2 seconds.

- Now, add another display matrix as () block and draw a bigger heart in the matrix as shown in the image.
- Add another wait () seconds block under the display matrix as () block and set the waiting time as 0.2 seconds.

- And there you go! Quarky’s heart beats only for you! Save the file as
Beating Heart.

Make sure you finish and submit the assignment, as well as take the quiz, before moving on to the next lesson.