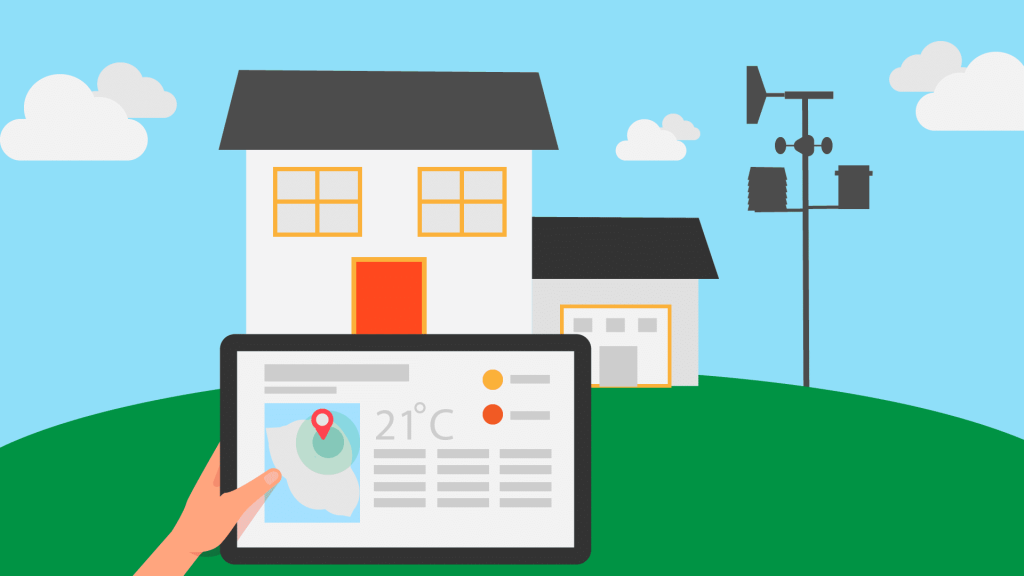

Weather Monitoring System

Why is it sometimes sunny outside and sometimes windy or rainy? How are we able to monitor the temperature of our area?
In this lesson, we’re going to learn all about weather and weather monitoring systems – what they are, why they’re important, and what are their advantages.
We’re also going to make our own weather monitoring system in PictoBlox using Quarky!

Let’s begin!
All About Weather Monitoring
Before we directly jump into making our very own weather monitoring system, let us first understand what weather and weather monitoring are and why weather monitoring is important.
What is the Weather?
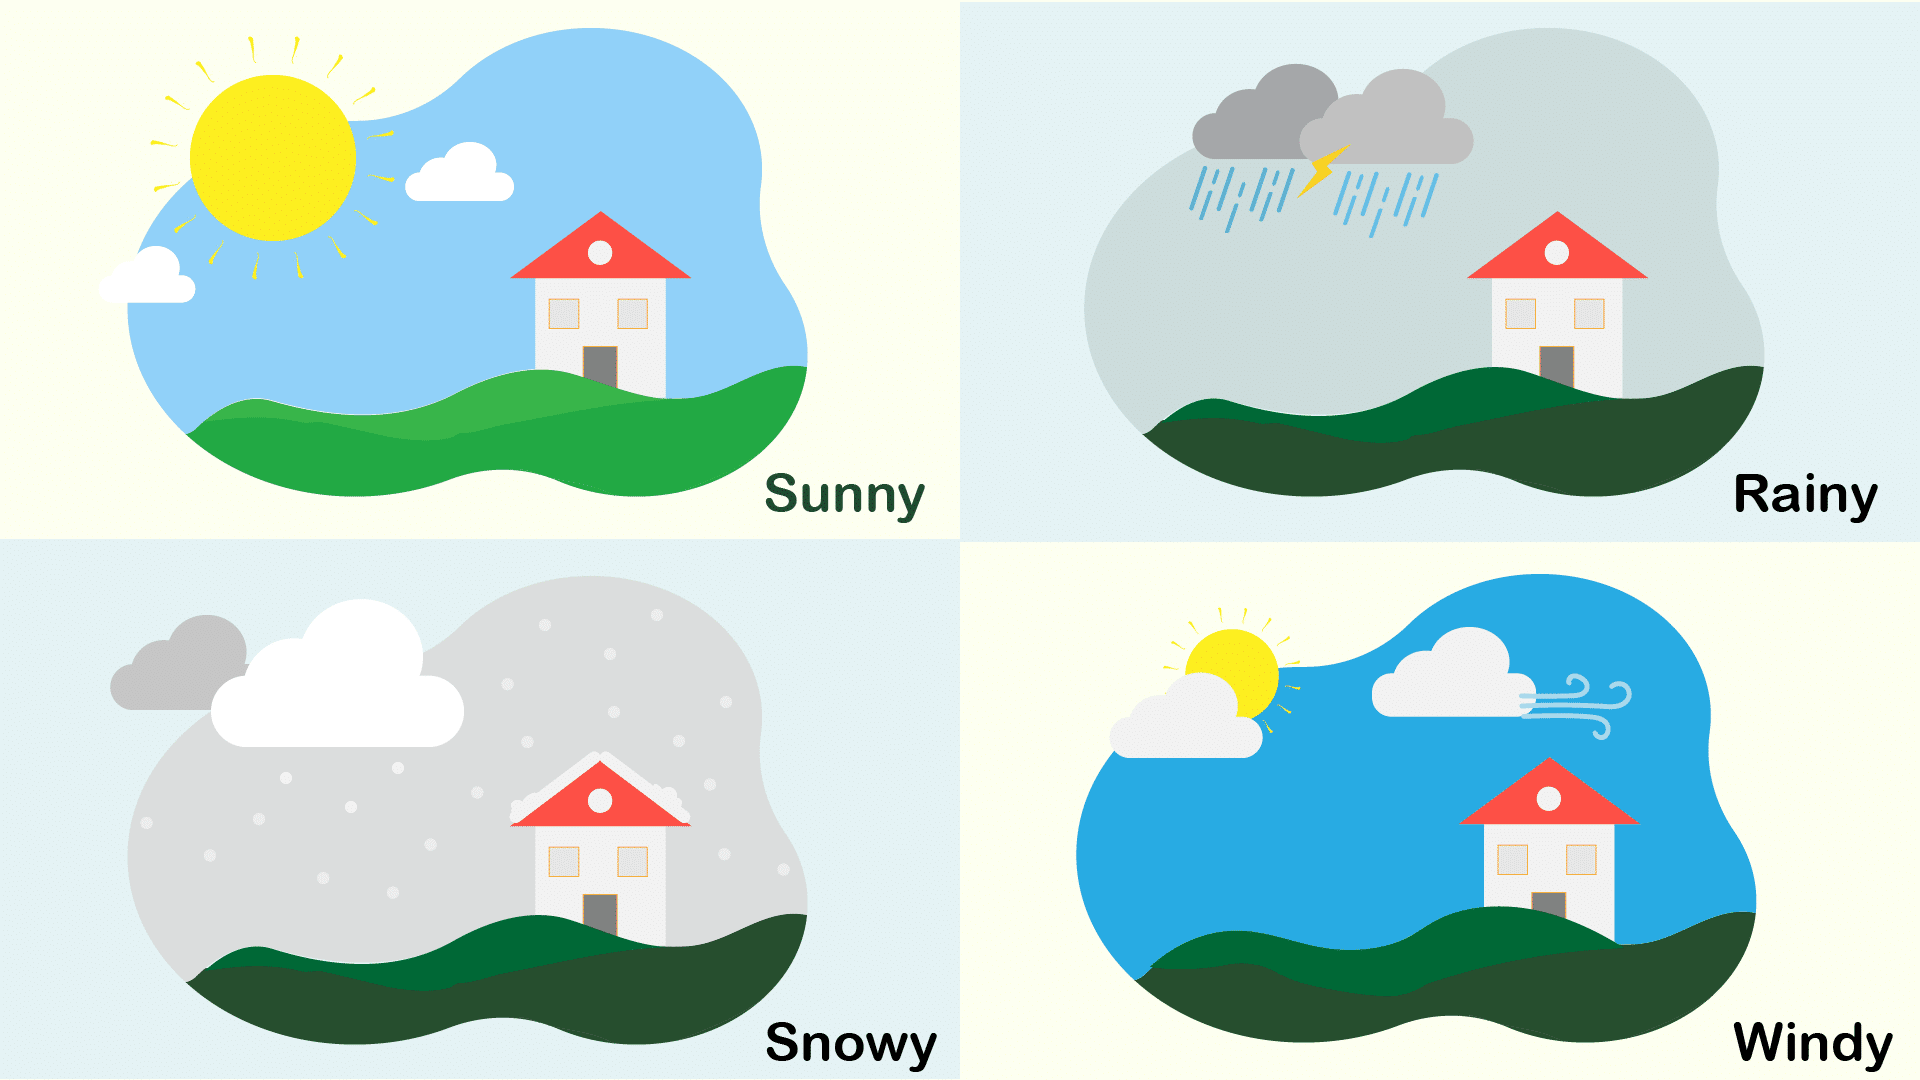
Simply put, the weather is what the atmosphere outside is like. It can be hot, cold, rainy, or cloudy. Weather changes daily. One day, it can be sunny outside and the other, it can rain cats and dogs!
What is Weather Monitoring?
Weather affects our daily lives – what we wear, how we travel, what we eat, and what we do. Bad weather conditions can make our day to day life difficult and in extreme cases, even destroy our homes and cause deaths.
Weather monitoring is keeping track of the weather and its different parameters such as temperature, humidity, and wind speed so that we can make decisions beforehand or prepare ourselves for any upcoming extreme conditions. This way, we can avoid or at least minimize the loss that bad weather might cause if we were not prepared.
You must have seen the weather app in your parents’ or elder sibling’s smartphone. It tells you what the maximum and minimum temperatures for the day are, whether it is going to be sunny or cloudy or rainy, etc. The app monitors the weather for you so that you can plan your day and avoid any problems.
Advantages of Monitoring the Weather
There are many advantages of weather monitoring. Some of them are:
- It helps farmers make informed decisions regarding crop growth, irrigation, the right time to apply fertilizer, and so on. This helps them minimize the damage, produce higher growth, and save money.

- Weather monitoring helps the tourism industry. Tourists plan their holidays according to the weather and this can help the industry to plan the facilities and use their money effectively.

- It also helps in road safety by assessing the conditions and informing the locals about them which then helps in preventing weather accidents.

- One of its major advantages is in disaster management. Timely monitoring and forecasting help in taking appropriate measures in case of bad weather conditions such as hurricanes or floods.


Now that we know quite a lot about the weather, let’s build our own weather monitoring system with Quarky’s help!
Collecting Data
Become we make our weather monitoring system, there are a few concepts that we must understand. Let’s have a look at them one by one.
In PictoBlox, to get the weather data of a place, we need to enter its latitude and longitude. Now, what ARE these things?
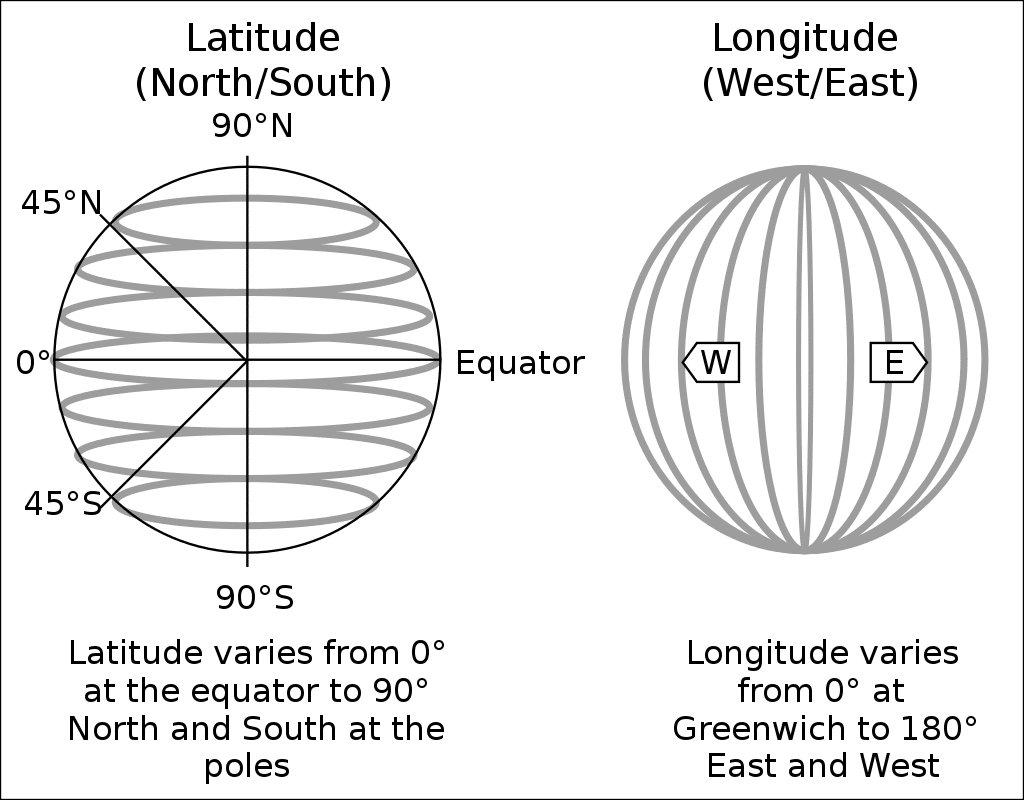
- Let’s first look at latitude. Latitude is a measurement that tells how far north or south a particular place is from the equator. Latitude is measured in degrees with 180 imaginary lines that form circles around the Earth that are parallel to the Equator. These lines are called parallels.
- Longitude is a measurement that tells how far east or west a particular place is from an imaginary line drawn from the North Pole to the South Pole that passes through a place called Greenwich in England. It is also measured in degrees.
Using both the latitude and longitude, you can find the exact location of any place on Earth.
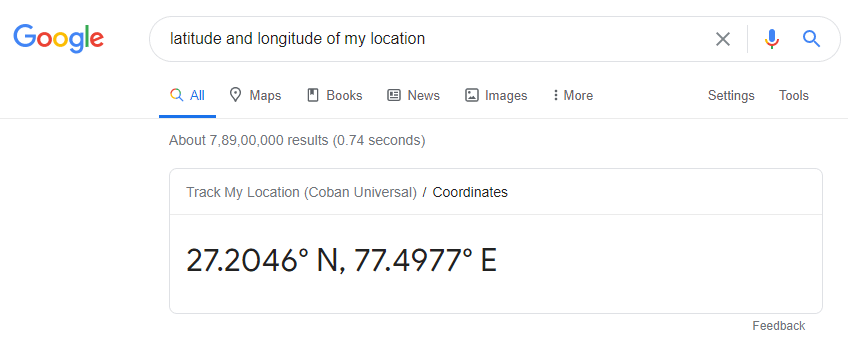
To find out the latitude and longitude of a place, directly write the latitude and longitude of [name of the place] in Google and it will give you the numbers.
After entering the latitude and longitude of a place in PictoBlox, you can get its temperature, humidity, weather conditions, wind speed, sunrise, and sunset, etc.
Activity: Weather Monitoring System
Now, let’s make the script for our weather monitoring system!
Let’s Code!
Follow the steps below to make the script in PictoBlox:
- Now, Open PictoBlox and open a new project by selecting New from File.
- Connect Quarky to PictoBlox.
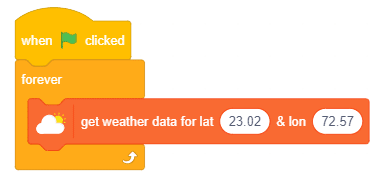
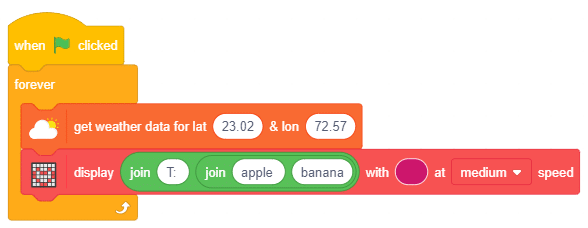
- Go to the Events palette and add a when flag clicked block into the scripting area.
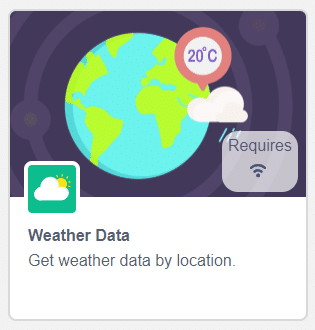
- Add a forever block below the when flag clicked block.To get the weather data, we must first add the Weather Data extension.
- Click the purple-colored Add Extension button in the bottom-left corner of the screen. Then, select the Weather Data extension to add it to your palette.

- From this extension, add a get weather data for lat () & lon () block inside the forever block and enter the latitude and longitude of the city you live in.
Displaying the Data
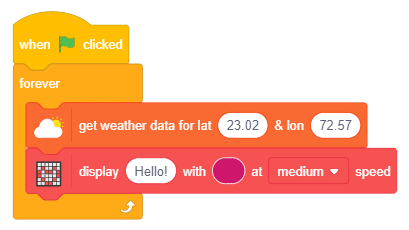
Now, let’s add the blocks for displaying the data on Quarky’s matrix.
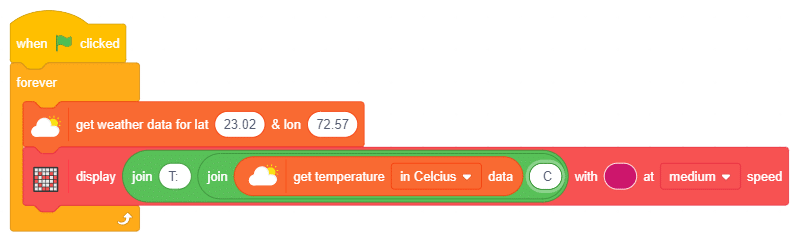
- Go to the Display palette and add a display () with () at () speed block below the get weather data for lat () & lon () block. We’ll use this block to display the data on Quarky’s matrix. Let’s first get the Temperature.

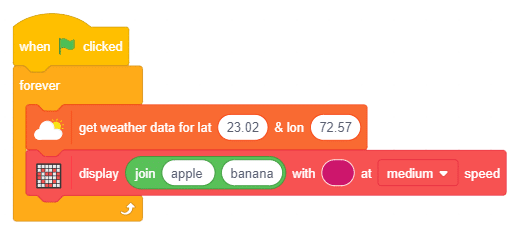
- Inside the first space of the display () with () at () speed block, add a join () () block from the Operators palette and set the display color to dark pink from the drop-down and keep the speed as medium.
 In the first space of the join () () block, write “T: ”. In the second space, add another join () () block.
- In the first space of the second join () () block, add a get temperature () data block. As you can see, the default unit of measurement of temperature is Celsius. You can change it to Fahrenheit from the drop-down if you want to.

- In the second space of the second join () () block, write “ C”.
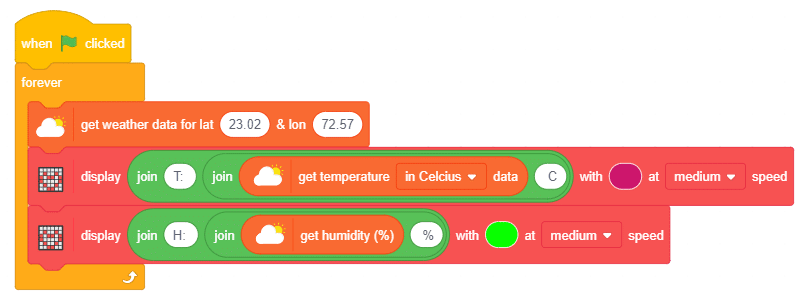
- Add a second display () with () at () speed block and set the display color to green.
- Inside the first space of the display () with () at () speed block, add a join () () block.
- In the first space of the join () () block, write “H: ”. In the second space, add another join () () block.
- In the first space of the second join () () block, add a get humidity (%) block. In the second space of the second join () () block, write “ %”.

- Add a third display () with () at () speed block and set the display colour to blue.
- Inside the first space of the display () with () at () speed block, add a join () () block.
- In the first space of the join () () block, write “W: ”. In the second space, add a get weather block.
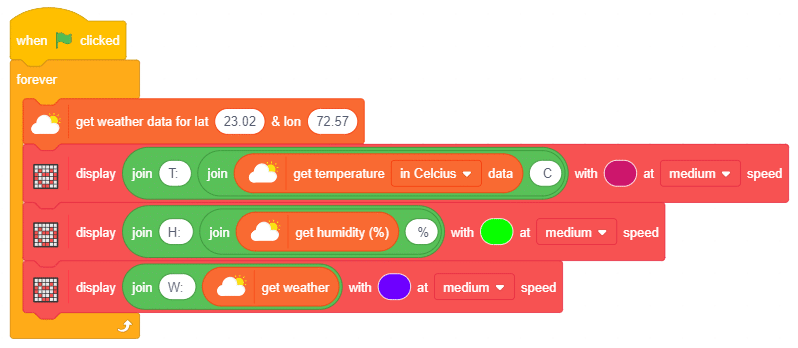
Click the green flag to run the script.
Save the project file as Weather Monitoring System.